TOC:
- Introduction
- EM Wave Basics
- Comparison of the optical image and SAR image
- Comparison b/t different Remote Sensing Methods
- Need of sar
- How it is captured
- Deep into range and azimuth resolution
- Different ranges k-band,x-band etc and applications
- Scattering
- Why it uses side projection
- Comparison with bats
- What is footprints
- What is antena
Introduction:
I have always been a computer vision fanatic, and I got to learn a lot more about this domain and its real-life applications from my internship at IIT, Kharagpur. I was assigned to work on PolSAR images for various tasks like image segmentation, colorization, etc. I knew only the bare minimum information that was required for applying deep learning, but a few weeks back I got some time to look back on this field and learn some of the basics, and this blog post is a part of that. This field extensively involves maths, and physics [spacially electromagnetic waves], reading only the theory is never that exciting but when we see the applications it suddenly makes the field very interesting, here you will mostly learn about the application of EM waves in satellite imagery. While learning I found out that the resources on these topics and other advanced SAR image topics are very less shared on the internet. This is another reason behind writing this article. I’m definitely not an expert in this field, I learned about them from all the links provided in the reference part, if you find any faults or miss information please comment below.
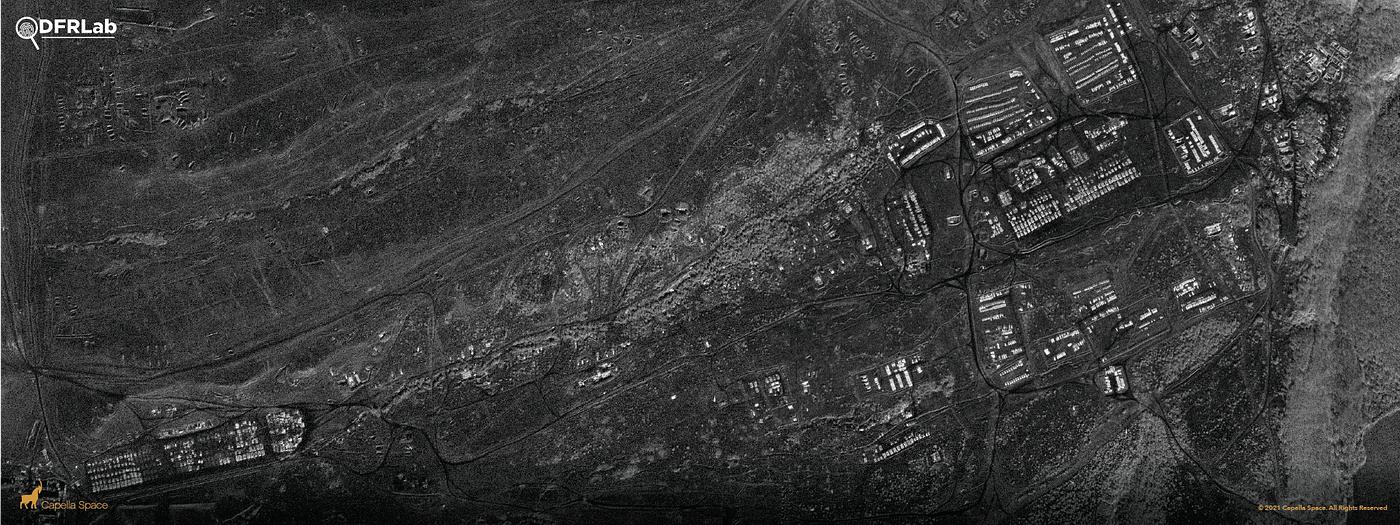
Ever thought about your life without Google maps, people use this google product all the time. Even your uber won’t move an inch without google maps(or any software for aerial maps, apple maps excluded [meme]). Or think about life without your smartphone’s weather forecasting, you won’t be able to take an extra umbrella for your crush on a rainy day, just kidding…, life would really suck, right? And these aerial maps and weather forecasting are by-products of satellite imagery, and not only that forest fire detection, seasonal vegetation change tracking, flood mapping, ship detection, oil spill detection, crop classification, and the list goes on. What is really creepy/sussy is, that we can measure, identify and track human activity with it. Even satellite imageries are intensively getting used to track the current war between Ukraine and Russia. Posibilities are infinite XD
The average Apple Maps user pic.twitter.com/8KRSlPiL2F
— Ecuadorian DeLorean (@EcuaDeLorean99) April 27, 2021
Comparison b/t different Remote Sensing Methods:
Satellite imagery comes under a broader topic called remote sensing, the name is pretty much self-explanatory. The basic concept is to sense different information about an object without getting into direct contact with the object. For that different kinds of sensors are used, for example, optical multispectral, thermal remote sensing, radar remote sensing, hyperspectral remote sensing, microwave remote sensing technique, etc. Optical RST is a passive remote sensing technique and microwave RST is an active imaging multilook RST.
There are many advantages of using microwave remote sensing[also known as sar] over others, but a few very important ones are
- SAR images can see through clouds, but other imaging techniques like optical or lidar are blocked by clouds. This is because of the different wavelengths used in different techniques, as the wavelength for SAR is from 3 cm up to a few meters, because of that it can easily ignore the dust particles of the cloud, but others can’t. These wavelengths fall within the microwave part of the spectrum in the figure below.

image 1, image 2[sahara desert]: Source
- It can be used to detect objects day and night the times, same goes for lidar sensors but unlike optical imagery.
- Multifrequency dataset can be accessed from the optical sensors but in the case of SAR sensor, it is only designed for one frequency/wavelength.
But unfortunately, there is only a handful of spaceborne and airbornes are out for collecting the SAR data, but with time applications are seemingly increasing and more and more of them are about to be deployed in near future.
A detailed comparison between SAR vs LIDAR vs Optical is provided below,

image 1, image 2[sahara desert]: Source
Comparison of the optical image and SAR image:
- Microwaves are primarily sensitive to structure, water content, and also dielectric nature of the material. but Optical data are reflectance spectra obtained from sunlight and are primarily sensitive to the illumination characteristics and molecular components of the region being imaged. Optical images are most sensitive to color information but not SAR images. Here in the image, the right side image is the SAR image and the left side image is the optical image. You can see that there is a dam at the bottom of the SAR image but that information is a mission in the optical image. And this is because optical images take color information into consideration.
In this image, we can see the clear topographical information for the SAR image but not for the optical image. And rever channels are also not visible in the optical images.
Here is another example where optical sensors were unable to collect the proper information from the terrain, this is an image of the Sahara desert and if you focus on the streep then it reveals previously unmapped drainage channels from an earlier, wetter geological era. This thing is done by applying the L-band signals. The vegetation and surface penetration capabilities have been applied in the field of archeology as well.

image 1, image 2[sahara desert]: Source
EM Wave Basics:
Let’s go through some basics of Electromagnetic radiation, below is a picture of an electromagnetic wave. as the name suggests, it is made of an electric field and magnetic field. The electric field varies in magnitude in a direction perpendicular to the direction in which the radiation is traveling, and the magnetic field is oriented at the right angle to the electrical field(M), both the fields travel at the speed of light(c).
- wavelength: length of one wave cycle or the distance that a point has to travel to get back to its previous amplitude and phase is called wavelength.
- frequency: repeating event per unit of time
The relation between these two is, $c = \frac{lambda}{v}$
This might come to the mind what is the need for multiple frequencies/wavelengths for remote sensing, the answer is higher the wavelength, the higher the penetration capability. And based on that there are different applications for different bands. Say someone is interested to do mapping and monitoring below forest cover or subsurface mapping or monitoring, they will need high signals with high wavelengths, in this case, according to the requirements that person will use the L band or P band. The below diagram explains the situation properly,

image 1 Source
Data collection:
SAR airbornes/spaceborne collecting data is similar to how bats locate objects. How bats locate objects are called “echolocation”, they emit ultrasonic sound pulses and receive the echoes to create an image of their surroundings. This is as same as how SAR satellites collect data. Sar sensors throw EM waves out in a side projection manner[it is side projection because if the projection is done perpendicularly wrt the satellite, then there won’t be much scattering that will lead to less ground coverage], and the amount of area that signals cover at one-time stamp is called footprint. When the signals incident with the ground they will scatter depending on the kind of objects they incident on. There are different categories of scattering that occur, like 1. surface scattering, 2. Double bounce scattering and 3. volume scattering. Depending upon the shape, building materials, dielectric value, etc. this scattering happens, some singles get lost and some reflect back to the satellite antenna and the SAR technology uses that eco/reflection to generate an image of the footprint. Here surface scattering is the scattering when the incident ray interacts with a nearly smooth surface, generally, it’s a scattering generated via surfaces. 2nd comes the Double bounce scattering, this happens when the signal gets incident on first a surface and then on a tall wall, as it is based on two scatterings so it is called double-bounce scattering. And describing Volume scattering as, when incident ray falls on a tree or vegetation some of the say get reflected bottom parts of the tree, like reflection due to upper leaves and brunches and then gradually moving down toward lower branches and leaves. Because of this, the entire body of the object causes scattering. The below diagram describes this better

image: Source
Synthetic Aperture radar:
If you break down the name, it comes like Synthetic + Aperture + radar. synthetic is something that is artificially created, and Aperture is defined as the area, oriented perpendicular to the direction of an incoming electromagnetic wave or you can think of it as an antenna, and radar is a detection system that uses radio wave[EM waves comes under radio waves]. Now the question arises why do we need a synthetic aperture/antenna? Apparently bigger the antenna more the information you collect but the antennas of a satellite are not that big so we use the forward motion of the satellite to create a synthetic antenna. Pink elliptical circles are the footprint of the satellite.

image: Source
The satellite moves forward and it emits the signals side ways[side looking geometry], and because of that, the group is scanned in two dimensions. One dimension is called the range dimension and the other is the azimuth dimension. Just of clarity, Azimuth is the direction where the satellite is moving and the direction where the signals are emitting is called range direction [see the image]. the angle between the nadir point and the direction of the emitted ray is called the look angle and the angle between the incident ray and the perpendicular to the ground is called the incident angle. the major axis of the ellipse is the swath and the slant range is the length b/w endpoint of the ellipse and the antenna. the area near the nadir point is called the near range and the area far away from the nadir is the far range.

image: Source
Resolution of SAR images:
We describe resolution in images are how many pixels are present in that image, and how clearly you can see every little detail of the image. In audio data restoration is defined like this, the sound is a longitudinal wave and to represent that kind of wave on a computer system in a continuous manner you need to increase the sample rate, this sample rate represents the resolution of audio, mainly if you represent audio on the computer then how continuous it is that is measured by the sample rate. But in the case of SAR images, there are 2 dimensions one is azimuth[vertica/height] and range[horizonta/width]. These two dimensions are defined as the ability to differentiate between two closely spaced objects in the respective directions. If we elaborate on this, then turns out something like this, when a signal hits two closely spaced targets then the ability to distinguish the echoes of these closely separated objects is called resolution here. Like other data, it also depends upon the ability of the device.
Range Resolution:

image: Source
The ability to distinguish between two echos coming from closely spaced objects in the range direction depends on the duration of microwave pulse transmitted by radar[quantifies time].
Range resolution = $c \times \frac{t}{2}$
if range resolution is defined as the separation between the eco pulses of two targets then, In this case, $c \times \frac{t_p}{2}$ is the range resolution, because there is no gap between pulses generated from $Ta$ and $T2$, then the $T2$ pulse is ending the $T1$ pulse is generating. so range resolution is the function of $t_p$.
Here you can see as the distance between two aircraft are shorter than the pulse length, the sensor is unable to detect the
Check this portion carefully, this pulse of t= 2us is emitted, so the pulse length is c x t = 600m and the range resolution is 600/2 m, now in this example as the distance b/w the two aircraft are 200 which is less than the pulse, so the sent pulse will be unable to detect the two objects/aircraft and may consider as the single image.

image: Source
Range resolution has two types, slant resolution and ground resolution,

image1: Source, image2: Source
There is another topic called Chirped pulse, which is used to describe range resolution. You can read more about them here.
Slant range ambiguity:
Objects appearing in the near range are compressed in their shape and size, this compression problem is called the slant range ambiguity. This should be minimized before further processing.
Azimuth resolution:
As discussed previously the azimuth resolution is the ability to distinguish two echos coming from two closely spaced objects in the azimuth direction. According to the formula, azimuth resolution depends on a few things as shown below,

image: Source
Complex form of SAR data and its deep learning applications of SAR data will be discussed in the next part.
References:
- https://medium.com/the-downlinq/sar-101-an-introduction-to-synthetic-aperture-radar-2f0b6246c4a0
- https://medium.com/the-downlinq/sar-201-an-introduction-to-synthetic-aperture-radar-part-2-895beb0b4c0a
- https://towardsdatascience.com/deep-learning-and-sar-applications-81ba1a319def
- https://albertum.medium.com/introduction-to-sentinel-1-sar-synthetic-aperture-radar-data-2cca22cb35a6
- https://mortcanty.github.io/src/tutorialsar.html#Vector-and-matrix-representations
- https://youtu.be/6cS-tq85Oic
- https://www.youtube.com/results?search_query=sentinal+sar+data+generation
- https://youtu.be/TkqIw0CBq5c manoj kuri
- https://youtu.be/ZCtjQDe3Mvc iirs
- IITB 3rd: https://youtu.be/sBCjOHPfD6U
- IITB 2ND : 4:42.1 https://youtu.be/wkpbDh2ysGs
- IITB 1st: https://youtu.be/Z16a3Bi6Gq0
- https://spaceknow.com/blog/3d-monitoring-of-mines-using-satellite-sar-data/
- https://edition.cnn.com/2022/02/02/europe/russia-troops-ukraine-buildup-satellite-images-intl/index.html
- https://cdn.cnn.com/cnnnext/dam/assets/220202125455-07-russia-buildup-satellite-exlarge-169.jpg
- https://edition.cnn.com/2022/02/02/europe/russia-troops-ukraine-buildup-satellite-images-intl/index.html